Soil moisture content refers to the moisture in the soil. We determine this by collecting a sample from each of our 36 plots at the Northeast Iowa Research Farm. The sample is taken back to the lab and the moisture content is determined by weighing the soil before and after drying. Soil samples were collected roughly every 2 weeks to get 12 soil samples for each plot.
Research Question
Does treatment have an effect on the soil moisture content?
More specifically, does the PGC system have the same, higher, or lower soil moisture content than our other treatments?
Data Visualizations
Sample code
trt_means = pd.DataFrame(soil_moisture.groupby('Treatment')['MC'].describe()['mean'])
trt_means = trt_means.reset_index()
trt_means['mean'] = 100 * trt_means['mean']
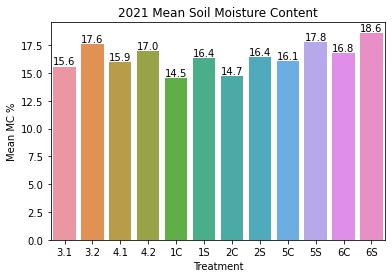
ax = sns.barplot(x = 'Treatment', y = 'mean', data = trt_means)
ax.set_title('2021 Mean Soil Moisture Content')
ax.set(xlabel='Treatment', ylabel='Mean MC %')
#for annotating
for p in ax.patches:
ax.annotate("%.1f" % p.get_height(), (p.get_x() + p.get_width() / 2., p.get_height()),
ha='center', va='center', fontsize=10, color='black', xytext=(0, 5),
textcoords='offset points')
plt.savefig('MC_bar_trt.jpg', bbox_inches='tight')
Code
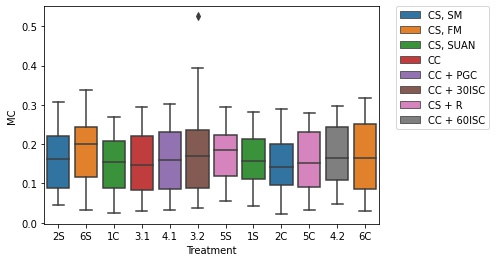
ax = sns.boxplot(x = "Treatment", y = "MC", data = soil_moisture, hue = 'Short Trt Description', dodge = False)
plt.legend(bbox_to_anchor=(1.05, 1), loc=2, borderaxespad=0.)
plt.savefig('trt_mc_box.jpg', bbox_inches='tight')
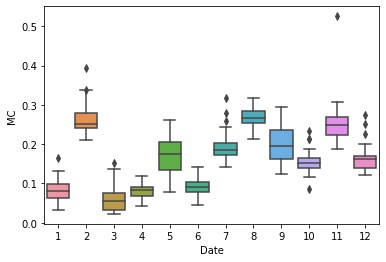
ax = sns.boxplot(x = "Date", y = "MC", data = soil_moisture)
plt.savefig('date_bc_box.jpg', bbox_inches='tight')
I wrote a function to make box plots for each date, but won’t incldude them on this post. You can see them in the jupyter notebook here: Link
def filterbydate (sampledate):
    sample_date_df = pd.DataFrame(soil_moisture[soil_moisture.Date == sampledate])
    return sample_date_df

sample_date = 1
while sample_date <= max(soil_moisture.Date):
    date_df = filterbydate(sample_date)
    date_df.boxplot('MC', by = 'Treatment')
    plt.title('Moisture Content by Trt on Date {}'.format(sample_date))
    plt.suptitle("")
    plt.ylabel("Moisture Content, DB")
    sample_date = sample_date + 1
ANOVA
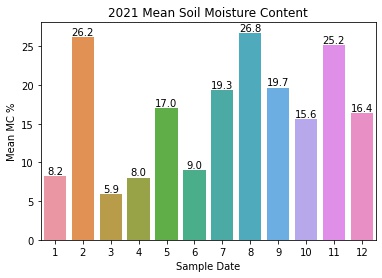
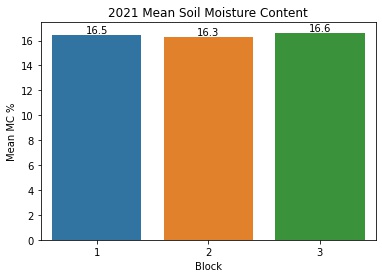
Seeing if block, sample date, or treatment had a significant effect on soil moisture content. I have a feeling that date will have a significant effect because the soil moisture content is very dependent on the weather of the days surrounding when we got the sample. I hope to see that block did not have an effect. I’m not sure what we will see from treatment, but some people believe that cover crop would make the soil drier because they are using any excess moisture.
Because we measured soil moisture multiple times throughout the season on the same plots, this is a time to use repeated measures anova.
Checking for normality
sns.kdeplot(data=soil_moisture, x="MC")
plt.title('Soil Moisture Kernel Density Plot')
plt.savefig('soil_moisture_kde.jpg', bbox_inches='tight')

import scipy.stats as stats
stats.probplot(soil_moisture['MC'], dist="norm", plot=plt)
plt.show()
plt.savefig('soil_moisture_probplot', bbox_inches='tight')
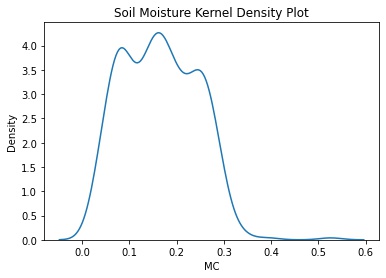
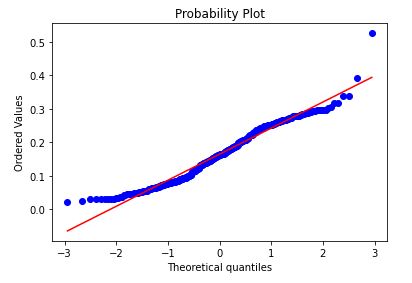
The data as a whole looks mostly normal.
Bartlett’s Test of Homogeneity of Variances
Using a function in pingouin to do the test for date, block, and treatment.
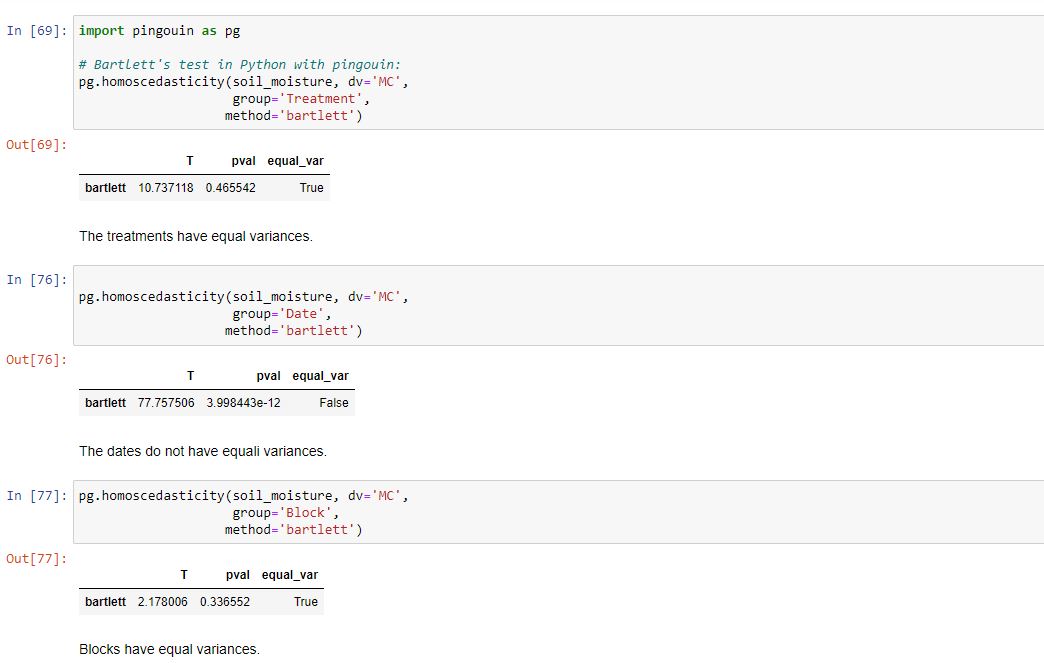
The date variable does not have equal variances.
I attempted to use a repeated measures ANOVA function in python:
from statsmodels.stats.anova import AnovaRM
I did not have luck using AnovaRM, so I used the mixed procedure in SAS to evaluate the effects because I have used it before and can get help from one of my committee members if I use SAS in my analysis. The most powerful covariance structure for the model I found was the hetereogenous compound symmetry (csh in SAS) structure. It had the lowest AIC and BIC values for the models I considered.
proc mixed data=A IC;
class Block Trt Date;
  model MC = Block Trt Date Trt*Date /ddfm =satterth;
  repeated Date / subject=Trt*Block type=csh r rcorr;
ods output infocrit=csh;
run;
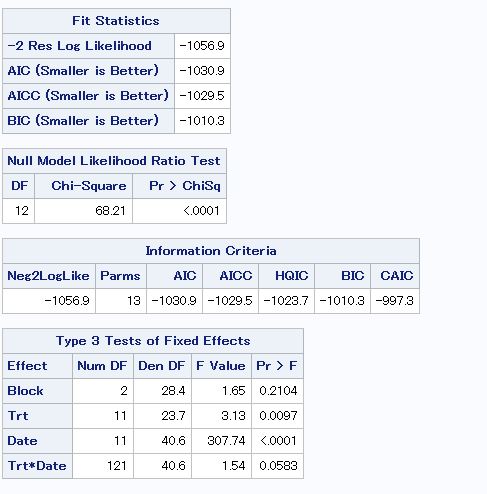
The results of the Null Model Likelihood Ratio Test tell me that using a repeated measures analysis is necessary. The Information Criteria are useful for comparing model structres, which I did and selected the csh structure after comparing. The Type 3 Tests of Fixed Effects results tell me that treatment, date, and the interaction between treatment and date are significant. More info on the ouput here.
To answer my research question, yes, treatment had an effect on soil moisture content.
I did a mean comparison of the treatments by adding the below code to my proc mixed statement.
lsmeans Trt / pdiff
It showed that the control (3.1) was drier than 3.2 (interseeded cover crops in 30 inch rows). The control was also drier than 5S and 6S, but that is not as interesting to me because the control was continuous corn so comparing to soybean treatments is not very useful. PGC was drier than 6S, but again I do not find that comparison very useful. 5C and 6S were also significantly different. 2S ansd 6S were significantly different and the only difference between those treatment was manure timing (but the 6S and 2S plots aren’t in corn this year, so this is not very relevant).